Second wave of COVID-19 pandemic made its way in US starting November last year and some counties of US
experienced unprecedented numbers of COVID-19 cases, though some counties remained in a bay of
stable cases numbers. Many researches explored different theories in order to understand such
enormous difference between counties’ cases - even within the same state. One of such theory was circulated
in a scientist’s community since 2011 when group of scientists from New Orlean University published their
article pertaining to hypothesis that absolute humidity modulates influenza virus survival and transmission.
They examined whether absolute humidity variability may have affected the geographic pattern of development,
or lack thereof, of a wintertime third wave of pandemic influenza in the continental United States and
concluded that the observed patterns of 2009 A/H1N1 transmission are consistent with the hypothesis that
absolute humidity modulates the survival and transmission of both epidemic and pandemic influenza viruses
in temperate regions [1].
After the COVID-19 pandemic started and made its way throughout the world, some scientists came back to this
theory, so a few articles have been published recently that made the hypothesis about correlation between
humidity and virus transmission rate more scientifically proven. One of such reseraches estimated the
relationship between air temperature or specific humidity (SH) and SARS-CoV-2 transmission in 913 U.S.
counties with abundant reported infections from March 15 to August 31, 2020 [2]. Researchers found that
both lower temperature and lower SH were significantly associated with increased Rt (transmission rate).
The fraction of Rt attributable to temperature was 5.10%, and the fraction of Rt attributable to SH
was 14.47%. These fractions generally were higher in northern counties than in southern counties. Their
findings indicate that cold and dry weather are moderately associated with increased SARS-CoV-2
transmissibility, with humidity playing a larger role.
The most recent article related to humidity influence on COVID transmission revealed how scientists vent
further in understanding of such influence by researching mechanistic nature of virus transmission in the
air[3]. Team, who published this article, documented and explained the strong dependence of SARS-CoV-2
stability on environmental temperature and relative humidity and they supported finding in previous
research [1] about U-shape effect of RH (relative humidity): at low RH risk of transmission increased,
the same was observed when RH was greater than 85%.
It is obvious that there are many other factors that may influence SARS-CoV-2 transmission rate, but if
correlation between humidity and such rate is significant - we may talk about some dependency. My study
intends to find is there correlation and how strong it is. I found daily atmospheric parameters
(temperature and dew points) for several weather stations located in different US counties by using
Global Surface Summary of the Day - GSOD datasets on NOAA site. I decided to use data for time period
between November 1, 2020 and December 22, 2020 when some US counties experienced enormous increase of
COVID cases. As such datasets don’t include relative humidity parameter - I made calculation based on
temperature and dew point using this formula https://bmcnoldy.rsmas.miami.edu/Humidity.html. Then, for
the same counties where weather stations are located (those which data I used) and for the same time
period I found daily COVID-19 cases numbers. I created Python scripts to compile, clean and calculate
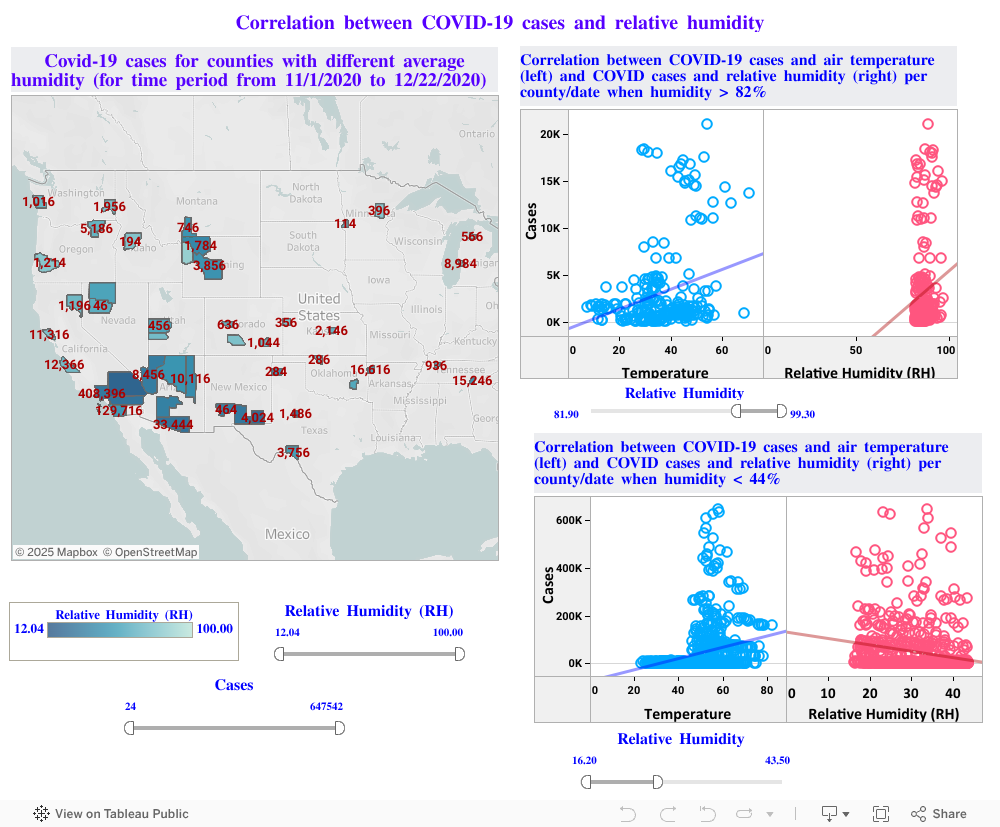
necessary data and then created Tableau dashboard to visualize the relationship between Relative
Humidity (RH) and COVID-19 cases number. One picture on my dashboard shows US map with COVID case numbers
for counties where low humidity was observed for specified time period (as this time period is prolonged -
it covers the lag of 7-14 between virus alleged transmission and confirmed COVID case.). Other two pictures
present COVID cases/Temperature and COVID case/Relative Humidity correlation: one is for counties with
daily average RH > 42% and it is showing that the correlation is positive, though not a strong for
temperature, but strong negative for RH (p < 0.0001); another is for counties with daily average RH > 82%
and correlation for RH is positive (p = 0.06). Anybody can see updated results for different humidity
interval by using slider for humidity filter.
Based on displayed results, it can be confirmed what was concluded in researches mentioned above:
such environmental factor as humidity influences virus transmission, i.e. low humidity increases
risk of transmission, while humidity interval between 42% and 82% doesn’t make a big impact on
transmission rate. .