Analysis and predictions of COVID-19 mortality per US county based on
county's population Health Conditions (as % to total population)
Abstract
As entire world continues to fight COVID-19, more and more researches
that are intended to better understand such invisible enemy as COVID are in
progress or already completed. I also made a small step in this direction and
now I present my current study where I try to analyze all possible correlations
between existing Health Conditions and COVID mortality in each of US counties,
as well as to predict COVID mortality in the same counties in the near future
(i.e. next 5 months). I collected data pertaining to each US county population’s
medical conditions by scrubbing respective numbers from the city-data site.
The Covid-19 statistics per state/county I found on CDC site and created script to
read/scrub such data. After numerous data massaging and manipulation I came up
with the Excel spreadsheet as my main data source for further analysis which I
performed by using Tableau Visualization and ML technics like Regression/Prediction
through the Python scripts. In the created dataset I considered all listed Medical
Conditions per county as a Features (independent variables) and Covid-19 Total Deaths
per county as a Dependent/Target variable.
Data Exploration
While performing Exploratory Data Analysis of my data I found that:
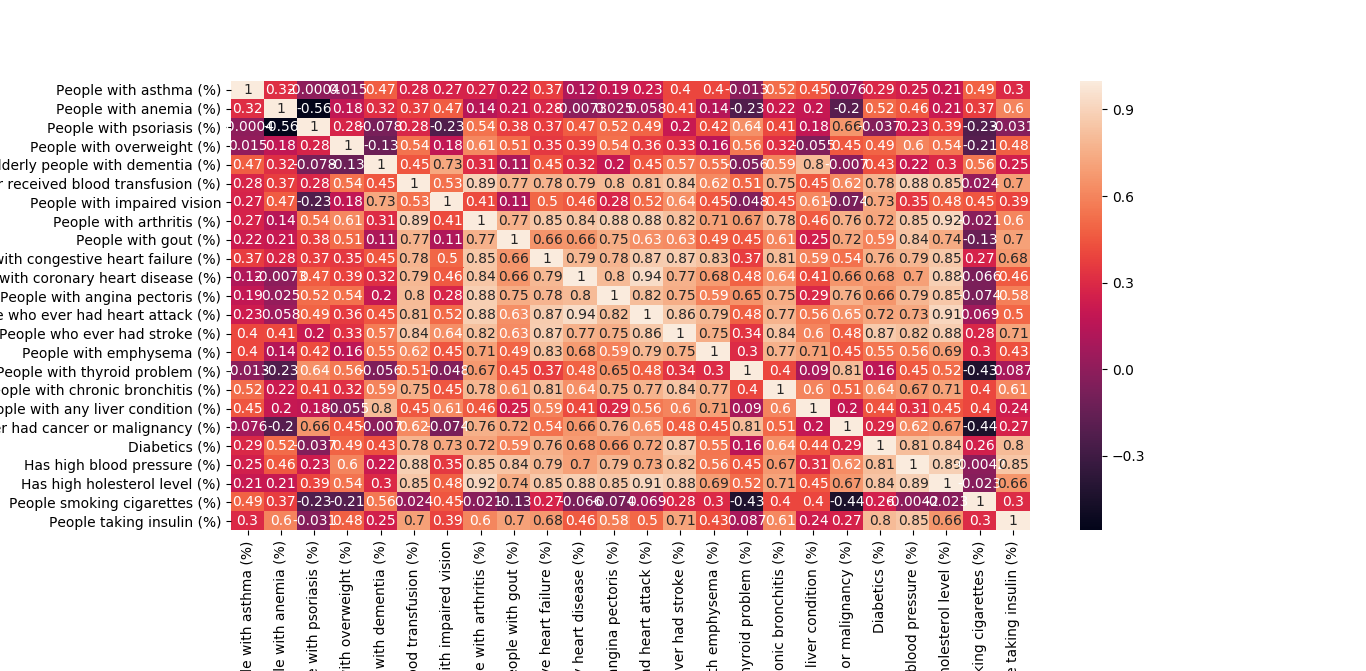
1) there are numbers of highly correlated between each other features which can make
an impact on the outcome of regression model (see correlation heatmap on Fig.1);
2) no linear correlation between each feature and target variable;
3) majority of the features have negative correlation with the target variable;
4) there are a few significant outliers in the target variable data set (we know that
some US counties have dramatical COVID death toll).
To address these anomalies I decided to explore 5 scenarios:
1)run entire Dataset (i.e. all states/counties) with all features;
2) select 5 Important features and run in the entire dataset;
3) select 8 Important features and run in the entire dataset;
4) exclude highly correlated features, then select 5 Important features among remaining
and run in the entire dataset;
5) exclude highly correlated features, then select 8 Important features among remaining
and run in the entire dataset.
Fig.1 Correlation Matrix
Data Model
I tried both Linear Regression and Random Forest models, but saw that Random Forest
is performing better – most likely, due to anomalies specified above, so only one (first)
scenario was ran twice under the each of these two models, then another 4 scenarios
specified above have been ran using Random Forest Regression model only. To address the outlier
presence, I tried to do a scale, but it didn’t improve scores, then I tries to use BoxCox, but
this method has modified target data significally, so I decided not to use this option because
the nature of target data became misrepresented. All rows in dataset was shuffled and then
the split was done to obtain train and test data sets. I tried 4 sets of Hyperparameres for
the RandomForestRegressor (using GridSearch), but due the nature of RandomForest model I
saw no significant differences in the scores, so I set parameter n_estimators (i.e. number of
trees) as 200 and max_depth as 10 for all of 5 scenarios. Important Features have been selected
using the Recursive Feature Elimination technic.
Output/Results
I saved output, which represent predictions, of the runs of 5 scenarios mentioned above in the
corresponding Excel files,as well as scores for each scenario and Features ranking results for
all scenarios except the first one. All of these files I used for the Tableau visualization that
consists of 3 Dashboards combined in one Story (see below).
Results/Scores Interpretation
Graph 2on Dashboard 1 shows that with all important features the Total Deaths is not changing
much except the known outliers. Similar for the predictive numbers on Graph 3 (same Dashboard 1).
The Features selection/Ranking results are presented on Dashboar 2: the features with rank 1
are considered as important and have been selected for scenarios 2-5. Features with the biggest
rank on Graph 4 on Dashboard 2 are considered as less important. As it can be seen on dGraphs 5 and 6
(Dashboard 2), some scores are negative, while some are relatively low (the Accuracy score is, indeed,
the mean of the cross-validation computation with the score parameter as neg_mean_squared_error).
The low scores can be explained by non-correlation of the majority of the features with the target
variable. This can be proved by changing any of the features filter slider on Graphs 7 and 8
(Dashboards 3): any significant change on those feature values can lead to the little change of
the Total Deaths figures.
Conclusion
It seems that there is no straight correlation between common diseases like diabetes, arthritis,
coronary heart disease, etc. and COVID-19 mortality. The medication taken by people suffered of
such disease may contribute to the COVID mortality prevention. For instance, doctors prescribed
Corticosteroids for people suffering of gout, arthritis, emphysema (and some other COPD), psoriasis.
People suffering of high blood pressure, coronary heart disease and similar problem are taking
Lozartan, anemia disease have a cure with the man-made form of protein, while for the thyroid
disease doctors prescribed the Levothyroxine. All of such medications have been named by different
researches as a potential reducers of COVID severe symptoms. But much more studies are needed in
order to make some definite conclusion about the possible impact of existing common medications on the
COVID-19 illness and mortality.
